Wealth Management

us.jpg   fr.jpg

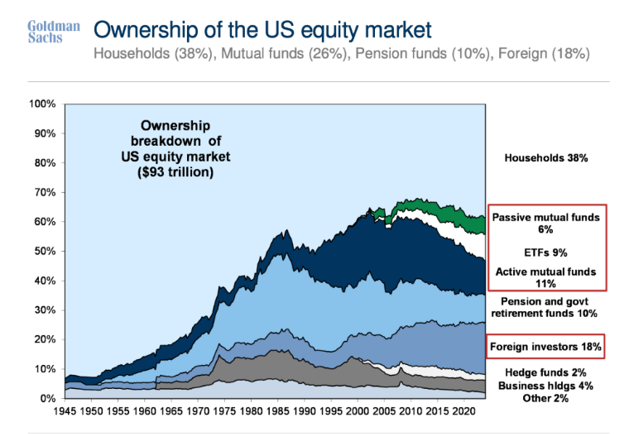
Ownership of the US Equity Market

215a34e1a1561d2bc3203abaf18ee2b7.png

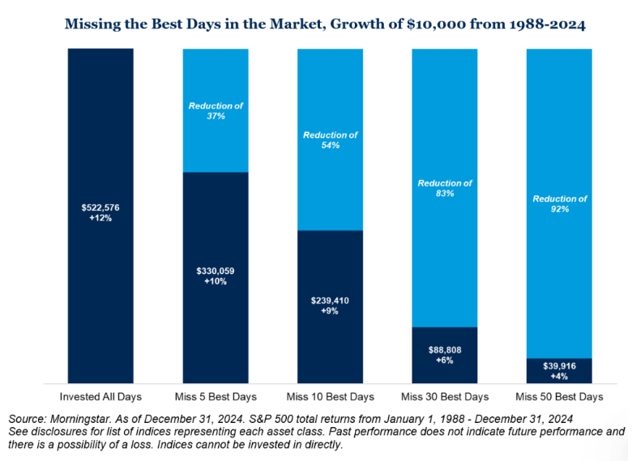
Impact of Missing Best Market Days (1988–2024)

b6171d1ab95593a6ae8a038480eba573.png

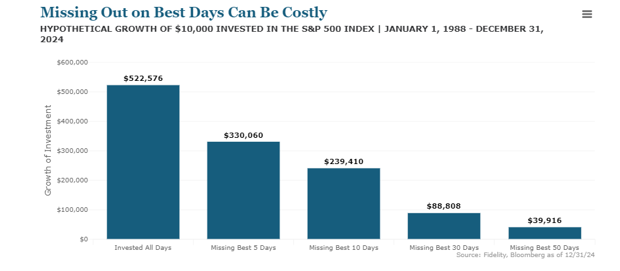
Cost of Missing Best Days in S&P 500 (1988–2024)

244e865f9519c46155b95001e2c1266f.png

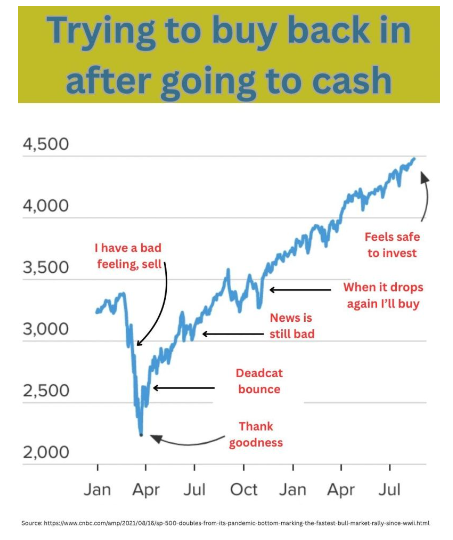
Buying Back After Selling Cash (Investor Behavior)

31853c126eb6234c1d72723b2e988c76.png

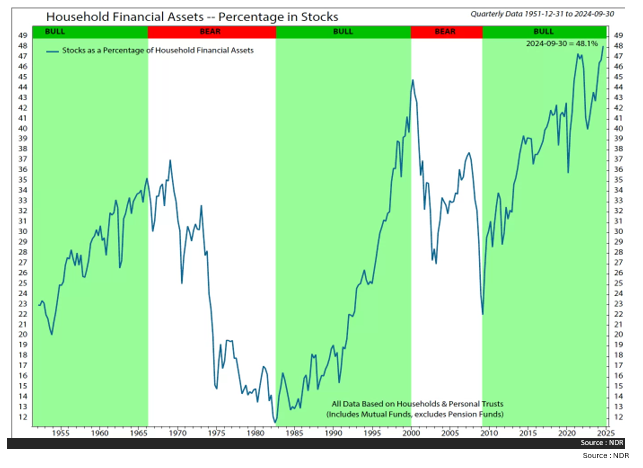
Household Assets in Stocks (1951–2024)

854b824aab19f53841dd5724673e370a.png

Active Fund Success Rates by Category (as of 2024)

26.png

Public and Private Manager Dispersion Chart

9.png

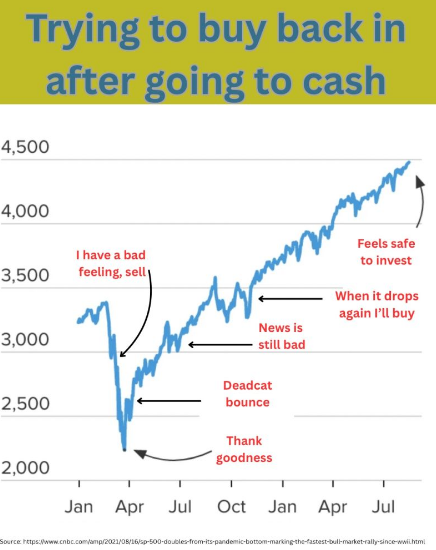
Trying to buy back in after going to cash

104.png

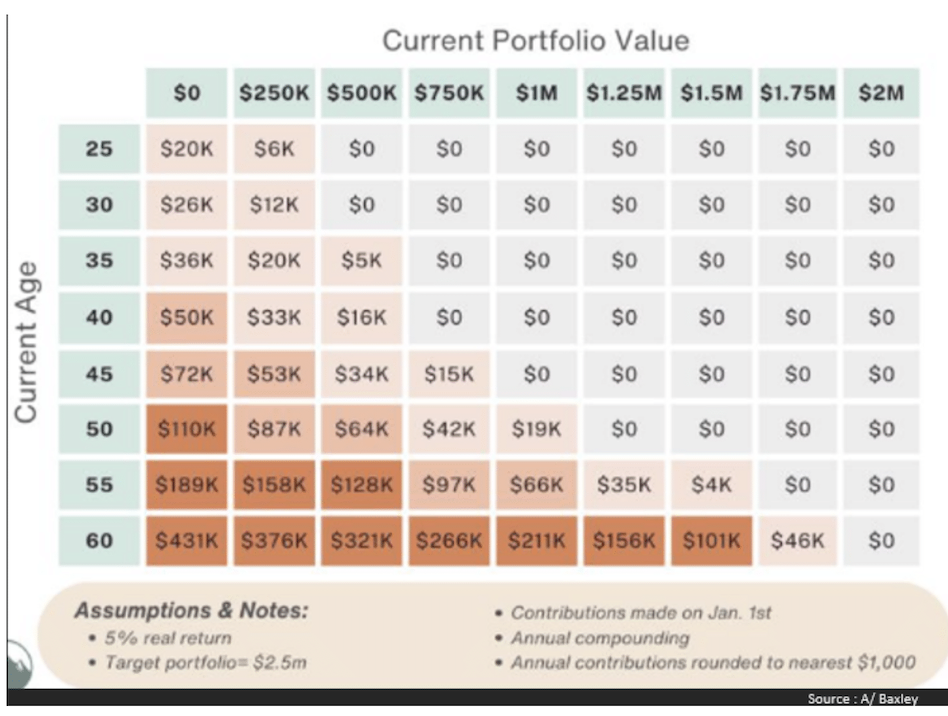
Required Annual Contributions to Reach $2.5M Portfolio

Chart 85.png

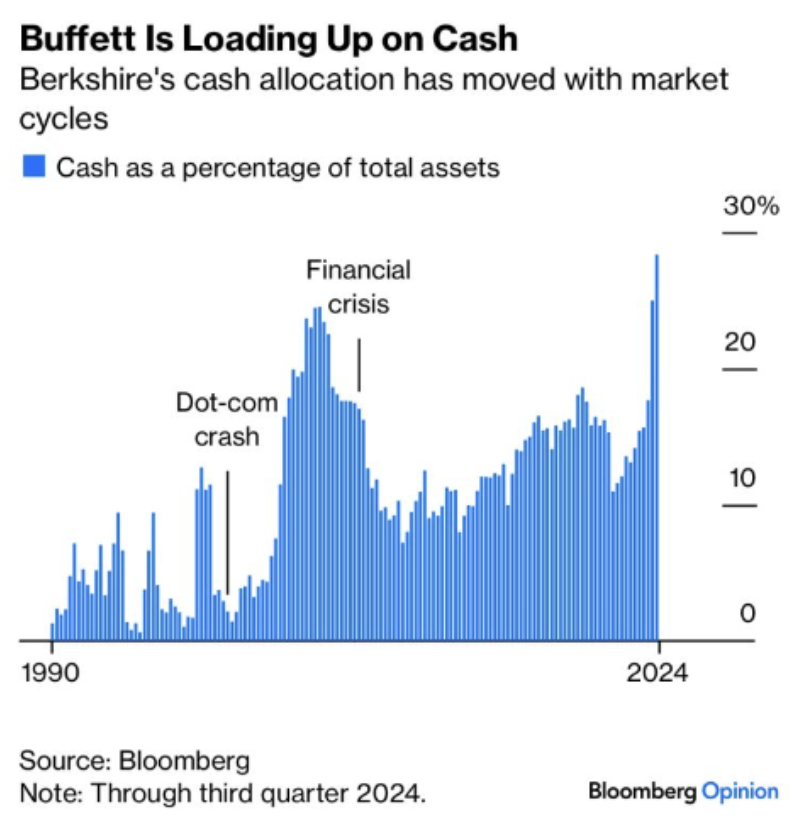
Berkshire's Cash Allocation Over Market Cycles

Chart 58.png

Syndicate content